

Most electrical contractors track numbers that don't help them make decisions. Revenue looks good this month? Great. But what about your callback rate climbing from 8% to 14% over the last quarter? Or your average ticket dropping $130 while labor costs stay flat?
The real problem isn't tracking metrics—it's knowing which metrics trigger specific actions. I've built operational software for contractors across the country, and the same pattern emerges everywhere: businesses collect data but don't have clear thresholds that tell them when to hire, when to retrain, or when to adjust pricing.
A properly wired KPI dashboard doesn't just show you numbers. It tells you exactly what operational change needs to happen when specific thresholds get crossed.
The Four Core Actions Your Metrics Should Trigger
Every metric on your dashboard should connect to one of four operational decisions:
Hire - Add capacity through new technicians, office staff, or specialized roles Retrain - Fix skill gaps or process failures through targeted training Reprice - Adjust service pricing, labor rates, or material markups Re-route - Change scheduling, territory assignments, or workflow patterns
The mistake contractors make is tracking vanity metrics that don't connect to these actions. Monthly revenue tells you almost nothing actionable. First-call resolution rate dropping below 75%? That's a clear retrain trigger.
Here's what actually matters: you need metrics that predict problems before they hurt profitability, and you need exact thresholds that trigger specific responses.
Mapping Each Metric to Its Operational Trigger
Revenue Per Technician
Never miss a job or delay a dispatch again.
Voltzly helps you schedule, assign, and track every electrical job efficiently.
- Unified job scheduling
- Real-time technician tracking
- Automated client notifications
No credit card required
Data source: Service management system, payroll records
Calculation: Total service revenue ÷ Number of active technicians
Check cadence: Weekly
| Metric Range | Action Trigger | Specific Response |
|---|---|---|
| Below $18k/month | Retrain or Replace | Skill assessment, ride-alongs, potential termination |
| $18k-$25k/month | Monitor | Weekly performance reviews |
| $25k-$32k/month | Optimal | Maintain current operations |
| Above $32k/month | Hire | Add technician capacity within 30 days |
When revenue per tech exceeds $32k monthly for three consecutive weeks, you're leaving money on the table. Your existing team is maxed out, likely rushing jobs or declining same-day calls. The hiring trigger prevents burnout and captures lost revenue.
Below $18k means either skill problems or workflow issues. Before firing anyone, check if they're getting dispatched to the right job types. A residential specialist struggling with commercial calls isn't a performance problem—it's a routing problem.
Callback Rate by Service Type
Data source: Service tickets, warranty claims
Calculation: (Repeat visits within 30 days ÷ Total completed jobs) × 100
Check cadence: Daily for new techs, weekly for veterans
| Service Type | Acceptable Range | Action at Threshold |
|---|---|---|
| Basic repairs | 0-5% | Above 5%: Individual retrain |
| Panel upgrades | 0-8% | Above 8%: Process review |
| New construction | 0-3% | Above 3%: Quality audit |
| Troubleshooting | 0-12% | Above 12%: Diagnostic training |
Callbacks destroy profitability faster than any other metric. A single callback on a $450 service call typically costs $280 in truck roll, labor, and opportunity cost. Five callbacks per week means $72,800 in annual profit erosion.
The critical insight: callback patterns reveal training gaps before they become reputation problems. If callbacks spike on panel upgrades but stay low on basic repairs, you don't have a quality problem—you have a specific skill gap.
Average Ticket Value
Data source: Invoice system, service reports
Calculation: Total service revenue ÷ Number of completed jobs
Check cadence: Weekly by technician, monthly company-wide
When average tickets drop below these thresholds, repricing or retraining becomes mandatory:
-
Residential service
Below $385
-
Commercial service
Below $650
-
Emergency calls
Below $500
-
Maintenance contracts
Below $225
The dangerous pattern: average tickets slowly decline over six months while technicians get comfortable quoting the same prices from last year. Material costs rose 8%, labor costs increased 5%, but ticket prices stayed flat. That's a 13% margin compression hiding in plain sight.
Track this metric by individual technician. If one tech consistently writes tickets 20% below team average, they're either missing upsell opportunities or underpricing from discomfort with customer conversations.
Schedule Efficiency Rate
Data source: Dispatch system, GPS tracking
Calculation: (Billable hours ÷ Total scheduled hours) × 100
Check cadence: Daily
| Efficiency Rate | Operational Impact | Required Action |
|---|---|---|
| Below 65% | Losing money | Immediate re-route |
| 65-75% | Break-even | Route optimization |
| 75-85% | Profitable | Monitor weekly |
| Above 85% | Optimal | Scale current system |
Geography kills electrical contractor profits. A technician driving 90 minutes between two jobs while three other calls sit waiting in the same neighborhood? That's a routing failure that shows up as poor efficiency rates.
When efficiency drops below 65%, you're literally paying technicians to drive instead of work. The immediate fix isn't hiring—it's reorganizing territories and dispatch logic. Most contractors see 15-20% efficiency improvements just from basic territory management.
First-Call Close Rate
Data source: CRM, phone system
Calculation: (Jobs booked on first call ÷ Total inbound calls) × 100
Check cadence: Real-time dashboard
This metric directly triggers staffing decisions:
-
Below 60%
Immediate retrain on phone skills
-
60-70%
Script optimization and call review
-
70-80%
Acceptable range
-
Above 80%
Add inside sales or dedicated scheduler
A contractor in Phoenix discovered their close rate dropped to 52% during lunch hours when their best scheduler took break. The solution wasn't training—it was staggered lunch schedules. Sometimes the data points to simple operational fixes.
Material Cost Percentage
Data source: Purchasing records, job costing
Calculation: (Material costs ÷ Job revenue) × 100
Check cadence: Weekly by job type
When material costs exceed these percentages, repricing becomes non-negotiable:
-
Basic service calls
Above 15%
-
Installation jobs
Above 35%
-
Commercial projects
Above 40%
-
Maintenance work
Above 10%
The hidden killer: technicians grabbing whatever's convenient from the truck instead of pricing materials correctly. One contractor found $47,000 in annual margin improvement just from implementing proper material tracking on service vehicles.
Building Your Trigger-Based Dashboard
Essential Data Sources You Already Have
Service management software: Job tickets, scheduling data, customer history Accounting system: Revenue, costs, profitability by job type Phone system: Call volumes, duration, missed calls GPS/fleet tracking: Drive time, idle time, route efficiency Inventory system: Material usage, costs, waste
The problem isn't lack of data—it's connecting these systems to create actionable triggers. Modern operational platforms can pull from multiple sources automatically, but even manual weekly updates beat flying blind.
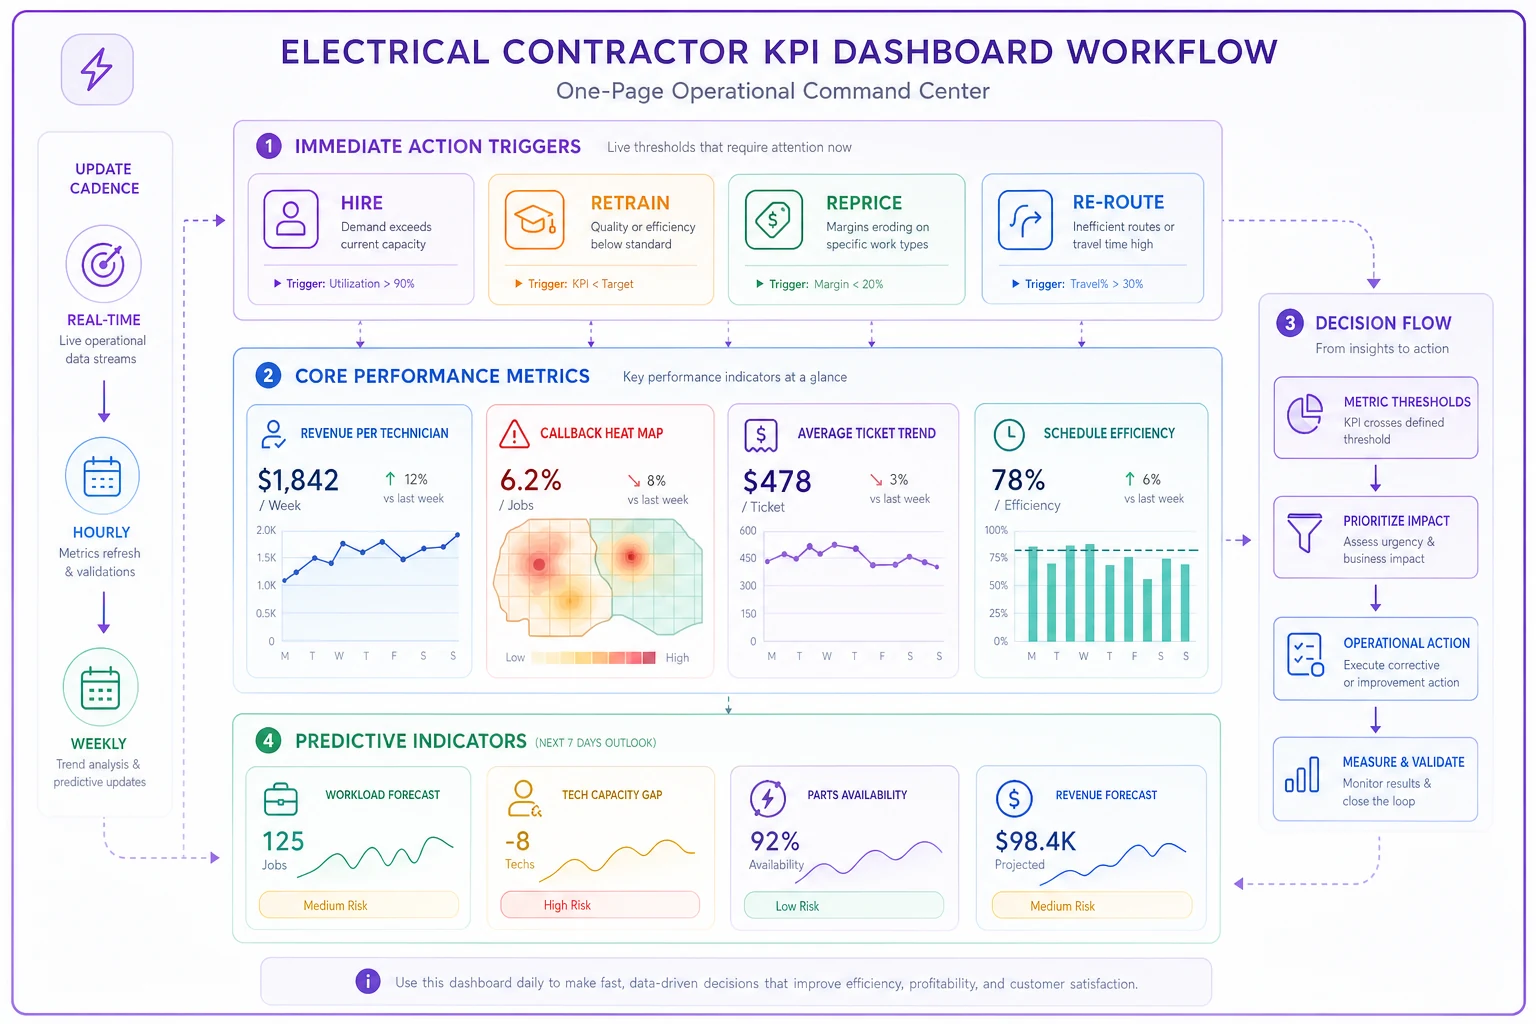
Sample One-Page Dashboard Wiring
Top Section - Immediate Action Required
-
Any metric in red zone (hire/retrain/reprice triggers)
-
Trending metrics approaching thresholds
-
Week-over-week change alerts
Middle Section - Performance Tracking
-
Revenue per technician (bar chart by individual)
-
Callback rate (heat map by service type)
-
Average ticket trend (line graph with threshold markers)
-
Schedule efficiency (daily percentage with target line)
Bottom Section - Predictive Indicators
-
First-call close rate (rolling 7-day average)
-
Material cost creep (variance from target)
-
Capacity utilization (current vs. maximum)
Here's a quick visual of the dashboard wiring.
Update Cadence Table:
| Dashboard Section | Update Frequency | Review Meeting |
|---|---|---|
| Action triggers | Real-time | Daily standup |
| Performance metrics | Daily refresh | Weekly ops review |
| Predictive indicators | Weekly calculation | Monthly planning |
The critical design principle: every number must connect to a decision. If you can't explain what action a metric triggers, remove it from the dashboard.
When These Triggers Actually Save Your Business
A residential contractor in Denver ignored their callback rate creeping from 6% to 11% over four months. They assumed it was just a tough stretch. When they finally investigated, they discovered one technician generating 40% of all callbacks. The issue? He'd been taking shortcuts after his third child was born and he was exhausted.
Instead of firing him, they moved him to inspection work for two months while he adjusted to the new schedule. Callbacks dropped to 4%, and they retained a skilled technician who just needed temporary support.
Another contractor noticed average tickets declining steadily. The assumption was pricing pressure from competitors. The data revealed something different: their senior techs were cherry-picking high-value jobs, leaving junior techs with basic repairs. A simple rotation schedule fixed the imbalance and raised average tickets by $95 within six weeks.
Common Implementation Mistakes
Tracking everything equally: Not every metric deserves daily attention. Callback rates need daily monitoring for new technicians but weekly is fine for veterans. Revenue per tech matters weekly, not hourly.
Setting universal thresholds: A 75% schedule efficiency might be excellent for rural territories but terrible for dense urban routes. Adjust thresholds based on operational reality, not industry averages.
Ignoring seasonal patterns: December callback rates always spike due to rushed holiday work. August efficiency drops during vacation season. Build seasonal adjustments into your triggers to avoid false alarms.
Creating complexity: The perfect dashboard that nobody understands is worthless. Start with five core metrics, nail the triggers, then expand. Most contractors try to track 30 metrics poorly instead of five metrics well.
Who Should Actually Avoid This System
This trigger-based approach fails for:
-
Contractors with fewer than 3 technicians (not enough data for patterns)
-
Highly specialized contractors (custom thresholds needed for every job)
-
Project-based electrical contractors (different metrics matter)
-
Businesses without basic digital systems (can't pull reliable data)
If you're still running operations on paper and whiteboards, fix that first. Digital operations enable measurement, and measurement enables improvement.
Making It Work Day-to-Day
Monday morning, 7:15 AM. Your dashboard loads automatically with weekend data processed. Three metrics show red:
-
Tech efficiency dropped to 61% on Saturday
-
Callbacks spiked to 9% for outlet repairs
-
Average emergency ticket fell below $500
By 7:30 AM, you've initiated:
-
Route review for Saturday (re-route action)
-
Outlet repair process review scheduled for Tuesday (retrain action)
-
Emergency call pricing update effective immediately (reprice action)
This isn't about perfection—it's about rapid response to operational drift. Small adjustments based on clear triggers prevent major problems.
The contractors who succeed with KPI dashboards don't try to optimize everything. They identify the 5-7 metrics that actually predict profitability, set clear thresholds for action, and respond immediately when triggers fire.
Most operational software now includes customizable dashboards with threshold alerts. The technology exists. The question is whether you'll commit to the discipline of trigger-based management or continue making gut decisions that leave money on the table.
Your callback rate is either below 5% or it's costing you customers. Your revenue per tech either justifies hiring or it doesn't. Your average ticket either supports profitability or requires repricing. These aren't complex decisions when you have clear triggers.
Stop collecting data that doesn't drive decisions. Build a dashboard where every metric connects to hire, retrain, reprice, or re-route. Let the numbers tell you exactly what to do next.
Ready to optimize your electrical service operations?
Join 500+ electrical service companies using Voltzly to improve scheduling accuracy, enhance client satisfaction, and boost operational efficiency.