

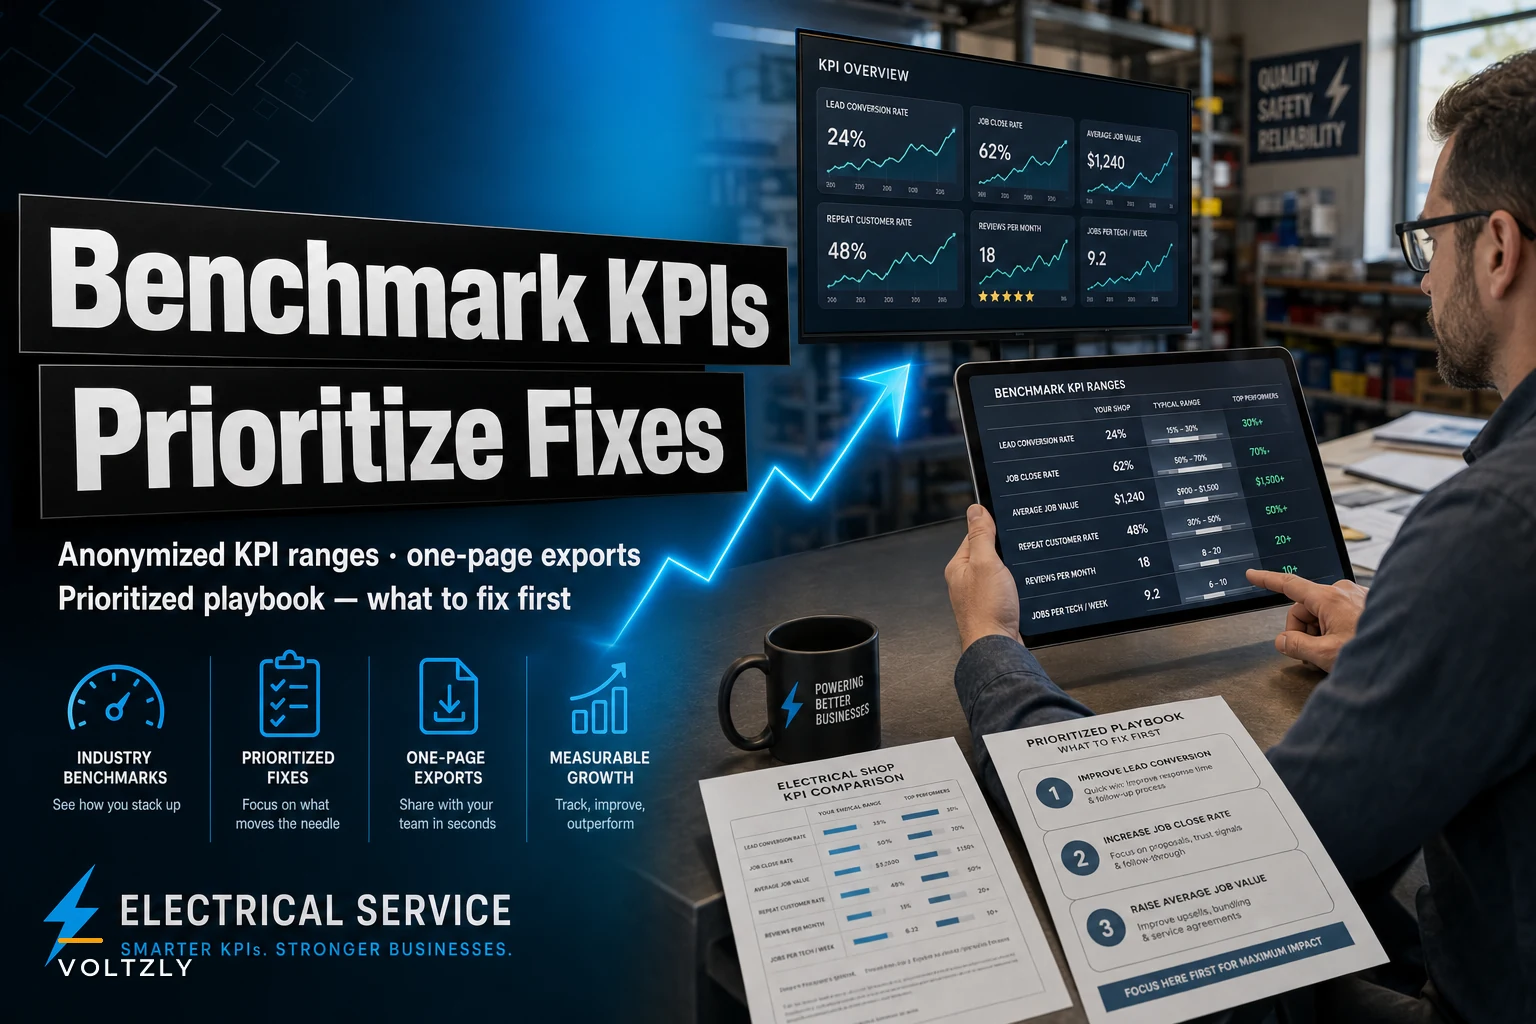

Most owners I talk to can quote their revenue off the top of their head but freeze when you ask what their average ticket is on service calls versus install jobs. That gap is the whole problem. You can't tell if a number is good or bad in isolation — you need a range to compare against, and you need to know which lever actually moves the needle when something is off.
So this is less a "here are 40 metrics" post and more a benchmarking guide electrical contractors can actually use: realistic ranges for the KPIs that matter most for a 2–15 tech shop, plus a prioritized order for what to fix when one of them is red. Because fixing the wrong KPI first is how shops burn six months chasing a problem that was downstream of something else entirely.
The ranges come first, then the remediation logic, then a one-page export format you can steal.
The benchmark ranges (anonymized, small residential/light-commercial shops)
These are blended ranges from small electrical shops — mostly residential with some light commercial, 2 to 15 field techs. They're not gospel. A rural shop with long drive times and a dense-urban shop will sit at different ends. Use them as a sanity check, not a scoreboard.
| KPI | Weak | Okay | Strong | Why it matters |
|---|---|---|---|---|
| Gross margin on service work | under 38% | 40–48% | 50%+ | Your actual profit engine; installs often subsidize or drag this |
| Net profit margin (whole shop) | under 4% | 6–9% | 10–14% | What's left after everything; below 5% means no cushion |
| Billable/utilized hours per tech | under 55% | 60–68% | 70%+ | Drive time, rework and idle hours live here |
| Average service ticket | varies | $350–$650 | $700+ | Depends heavily on market, but trend matters more than level |
| First-time fix rate | under 75% | 80–88% | 90%+ | Every missed fix is a second truck roll at zero margin |
| Callback / warranty rate | over 6% | 2–5% | under 2% | Silent margin killer, rarely tracked honestly |
| Quote-to-close rate (service) | under 30% | 35–50% | 55%+ | Low rate = pricing or trust problem |
| AR days (avg collection) | over 45 | 20–35 | under 20 | Cash timing, not profit |
| Revenue per tech per year | under $180k | $220k–$320k | $350k+ | Blunt productivity check |
| Callback cost as % of revenue | over 3% | 1–2% | under 1% | The number almost nobody calculates |
A couple of things worth flagging because they trip people up.
Billable hours is where the self-deception lives. A lot of owners assume their techs are running at 75% utilization because they're "busy all day." When you actually log it — travel, parts runs, standing in the supply house, re-quoting, waiting on the homeowner to move their car — the real number is often 58–63%. That's not a lazy-tech problem. It's a scheduling and prep problem, and it's usually the single biggest hidden drag in the whole table.
Callback rate is almost always understated. Shops count the ones that come back as formal warranty claims. They don't count the "hey can you swing by, that outlet you did is acting up" that a tech handles off-book to keep the customer happy. Those invisible returns are the ones eating margin, and they don't show up anywhere unless you force them to.
Why fixing KPIs in the wrong order wastes months
An owner sees net margin sitting at 4% and panics. Natural reaction: raise prices. So they bump rates 8%, and three months later margin has barely moved — and now their close rate dropped too.
Never miss a job or delay a dispatch again.
Voltzly helps you schedule, assign, and track every electrical job efficiently.
- Unified job scheduling
- Real-time technician tracking
- Automated client notifications
No credit card required
The problem wasn't price. It was that their first-time fix rate was 72%, meaning roughly one in four jobs needed a second visit that generated zero revenue. The pricing was fine. The rework was the leak. Raising prices on a leaky bucket just means you're pouring more expensive water into it.
KPIs are a chain, not a list. Some are symptoms and some are causes. If you treat a symptom like it's the cause, you spend real effort and real money on the wrong fix. This is the part most benchmarking content completely skips — they hand you the numbers and leave you to guess at the order.
The remediation playbook below is built around one question: when this KPI is off-target, what's actually upstream of it?
The prioritized remediation playbook
The rule of thumb: always fix the thing generating the loss before you fix the thing measuring the loss. Work in this order.
Pre-stage parts for the next day's jobs whenever possible; it's usually the fastest way to lift first-time fix.
1. First-time fix rate (fix this first, almost always)
If your first-time fix rate is under 80%, start here before you touch anything else. Everything downstream — utilization, average ticket, callback rate, customer trust — gets dragged by it.
-
Techs arriving without the right parts because nobody pre-staged the job
-
Vague job descriptions on the dispatch (customer said "outlet not working," reality was a subpanel issue)
-
No skills match — a two-year tech sent to a job that needed a senior hand
The fix is rarely "train the tech harder." It's upstream prep. Better intake questions, a quick photo from the customer before dispatch, and matching the right skill level to the job. When shops tighten this up, first-time fix often climbs from the mid-70s to the high-80s within a quarter, and utilization rises on its own because trucks aren't going back out.
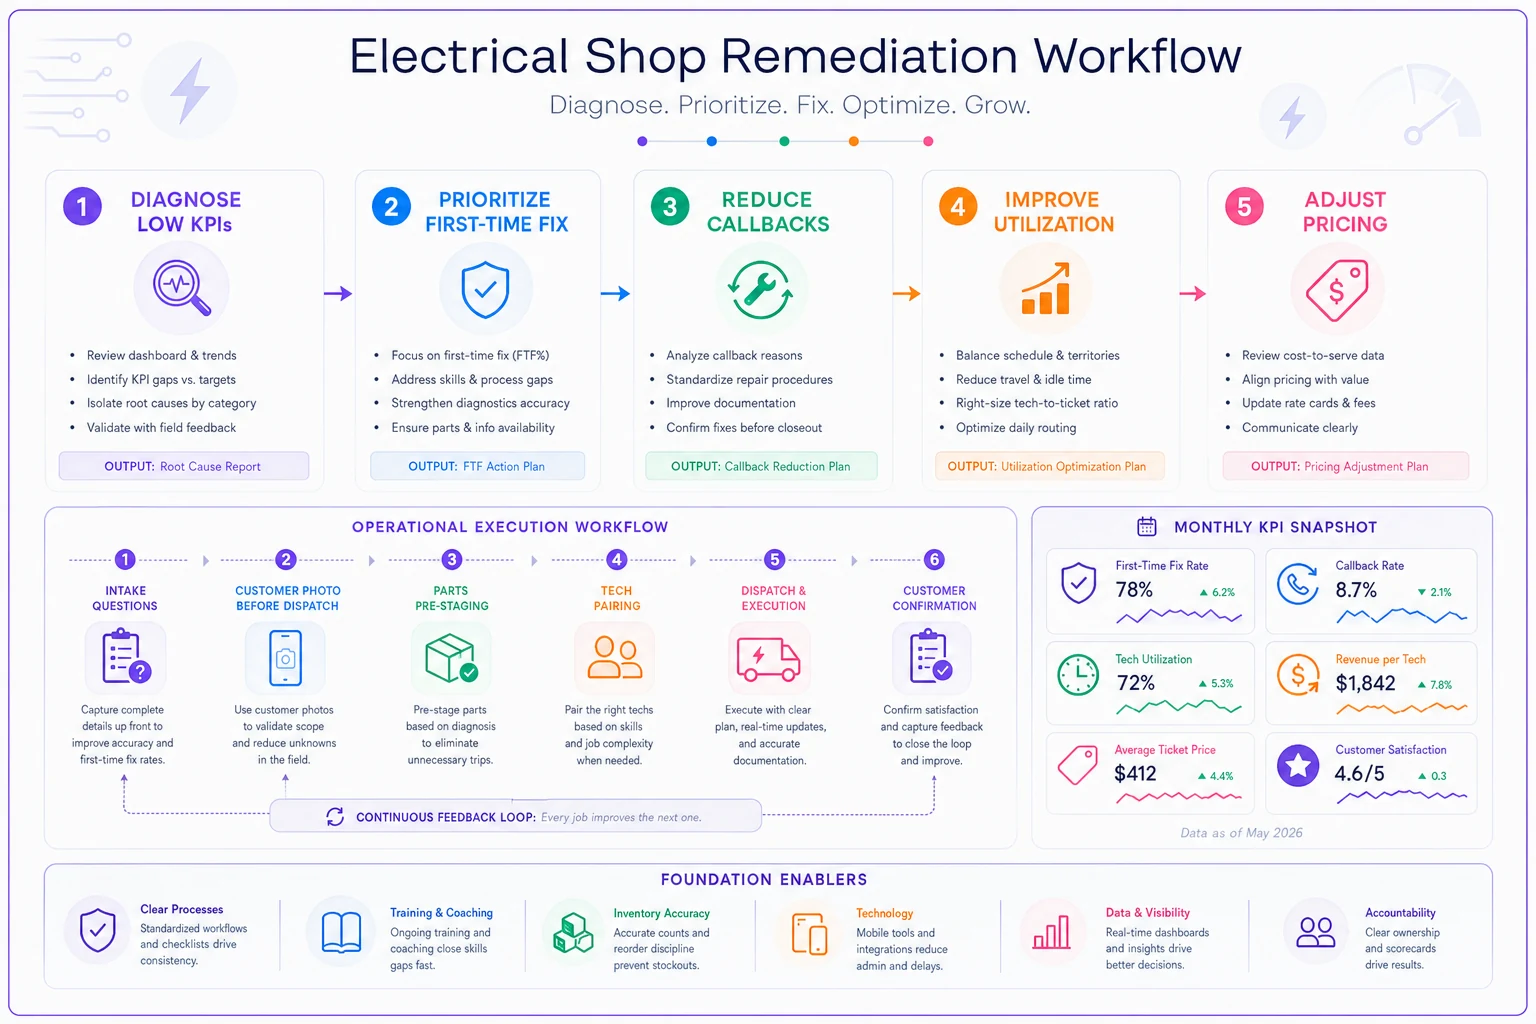
The diagram shows the recommended fix order and key actions at each step.
2. Callback / warranty rate (fix this second)
Callbacks are the clearest signal of quality problems and the most expensive thing nobody budgets for. A callback costs you the full truck roll, the tech hour, the part, and the customer's confidence — and it generates no invoice.
If your callback rate is above 5%, dig into which job types are generating them before you do anything shop-wide. Usually it's concentrated. Panel work, specific fixture installs, or one tech. The job-type profitability framework approach is useful here — once you break callbacks down by job type, you often find that the majority of your rework comes from just 2–3 categories.
3. Utilization / billable hours (fix this third)
By the time you've tightened first-time fix and callbacks, utilization has usually already crept up a few points on its own. Now you tackle the structural drag: drive time, parts runs, and schedule gaps.
The mistake here is thinking you need more jobs. Often you need tighter scheduling of the jobs you already have. If a tech is doing three parts runs a week to the supply house, that's four to six billable hours gone — somewhere in the range of $500–$700 a week in lost capacity per tech, before you've touched drive routing.
4. Average ticket and gross margin
Only now do you touch pricing and ticket size. Because once the operational leaks are plugged, a price adjustment actually sticks instead of getting eaten by rework. If gross margin is low and your fix rate and callbacks are already healthy, then yes — it's a pricing or job-costing problem, and that's a real conversation worth having.
5. Quote-to-close and AR days (fix these in parallel, last)
These matter but they're rarely what's bleeding you the most. A low close rate is usually a pricing-presentation or trust issue, not an operational one. High AR days is a process fix — invoice faster, follow up on a schedule — and it affects cash timing more than profitability.
A quick decision guide: which KPI is actually your problem?
Run through this before you commit to a fix:
-
Is first-time fix under 80%? → Fix that first. Stop reading. Nothing else matters as much right now.
-
Is first-time fix fine but callbacks over 5%? → Quality or skills problem. Break callbacks down by job type.
-
Are fix and callbacks both fine but utilization under 60%? → Scheduling and prep problem, not a workload problem.
-
Is all the operational stuff healthy but margin under 40%? → Now it's pricing or job costing.
-
Is everything fine but net profit still thin? → Look at overhead and AR, not field ops.
The whole point is to stop jumping straight to step 4 when your real problem is step 1.
A short real scenario
A six-tech residential shop in a mid-size metro was running around 5% net margin and the owner was convinced he was underpricing. His average service ticket was about $480, which felt low compared to a competitor he'd chatted with at a trade event.
When we actually logged the numbers, first-time fix was sitting at 74% and callbacks were running close to 7% once you counted the off-book "quick swing-bys." Utilization looked like 71% on paper but was really around 60% once parts runs were counted honestly.
-
Added three intake questions and a required customer photo before dispatch
-
Started pre-staging parts for the next day's jobs the evening before
-
Pulled callback data by job type and found most of it came from two fixture-install categories handled by one newer tech, who got paired with a senior guy for a few weeks
First-time fix moved into the mid-80s. Callbacks dropped to roughly 3%. Utilization climbed to about 66% just from killing the parts runs. Net margin landed somewhere around 8–9% — and he still hadn't raised a single price. Then he bumped rates about 6%, and because the operation was clean by that point, it actually stuck.
The lesson: the $480 ticket was never the problem. The second truck rolls were.
The one-page comparison export
If you're going to track this, don't build a 40-metric dashboard nobody opens. Build a one-page export you can glance at monthly and hand to a partner or bookkeeper.
SHOP KPI SNAPSHOT — [Month/Year] KPI This Month Target Range Status --------------------------------------------------------------- Gross margin (service) _% 40–48% 🟡 Net profit margin % 6–9% 🔴 Billable hours / tech % 60–68% 🟢 Average service ticket $ $350–$650 🟢 First-time fix rate % 80–88% 🔴 ← FIX FIRST Callback rate (honest) % 2–5% 🟡 Quote-to-close (service) % 35–50% 🟢 AR days 20–35 🟡 Revenue / tech (annualized) $ $220k–$320k 🟢 TOP PRIORITY THIS MONTH: _ (the single red/yellow KPI that is upstream of the others)
The "fix first" flag and the single top-priority line at the bottom are what actually matter. The rest is context. If you only look at one line on this page, it should be the priority line — because that's the whole philosophy here: one problem, fixed in the right order, beats ten problems you're nibbling at all at once.
Monthly is enough for most small shops. Logging this by hand in a spreadsheet works fine at first. The harder part is getting the raw inputs honest — especially callbacks and real utilization — which is where field-service tracking tools start earning their keep, because they surface the off-book returns and parts runs that never show up in a spreadsheet. If you want to go deeper on which numbers should actually trigger a hiring or repricing decision, the KPI dashboard breakdown walks through the action triggers.
When benchmarking like this doesn't make sense
If you're a one- or two-person shop, half these KPIs are noise. One bad month on a single big job swings your margin wildly. Track first-time fix and AR days, ignore the rest until you've got three or four techs.
If your market is genuinely different — remote rural territory with two-hour drives, or heavy specialty work — don't beat yourself up over a 58% utilization number. Compare yourself to your own trailing three months, not to a blended range from shops that look nothing like yours.
If every single KPI is red, don't try to fix all of them at once. That's the fastest way to fix none. Pick first-time fix, give it a full quarter, and let the downstream numbers follow. They usually do.
Benchmarks are a flashlight, not a verdict. The ranges tell you where to look. The remediation order tells you what to touch first. Get the order right and most of the rest of your dashboard quietly cleans itself up.
Ready to optimize your electrical service operations?
Join 500+ electrical service companies using Voltzly to improve scheduling accuracy, enhance client satisfaction, and boost operational efficiency.