



Most electrical shops know their overall gross margin. They can rattle it off — "we run about 38%." What almost none of them can tell you is which type of work is carrying the business and which type is quietly draining it. Panel swaps might be printing money while service calls lose a few points on every ticket. But when you blend everything into one number, the winners subsidize the losers and you never see the leak.
That's the core problem with how job profitability for electricians usually gets measured. The books are organized for the accountant, not the operator. You get a P&L that tells you the shop made money last quarter, but it can't tell you why, or where the next dollar of profit is hiding.
This article is about fixing that — not with more spreadsheets for their own sake, but with a job-type P&L structure, a review rhythm that actually catches problems, and a specific playbook for the four leaks that show up in nearly every shop: materials, travel, callbacks, and admin.
The measurement gap: why shop-level numbers hide the real story
A pattern worth understanding before we get into templates.
A three-truck residential shop pulls maybe $1.4M–$1.8M a year. The owner looks at year-end and sees a decent profit. Good year. But inside that number, the mix looks something like this: EV installs and panel upgrades are running healthy margins, small troubleshooting calls are barely breaking even after windshield time, and warranty callbacks are pure cost with zero revenue attached.
The blended margin looks fine precisely because the high-margin work is masking the bleeders. So the owner keeps taking every service call that rings in, adds a tech to handle volume, and can't figure out why more revenue isn't turning into more profit. Half the new revenue is low- or negative-margin work. That's why.
In real operations, this usually happens for three reasons:
-
Jobs are costed at the estimate level but never trued up against actuals per job type
-
Labor is tracked as a total payroll line, not attached to specific job categories
-
"Soft" costs — drive time, callbacks, admin churn — never land on any job at all
That third one is the killer. The costs that leak most are the ones your accounting never assigns to anything. They just sit in overhead, growing quietly.
Step one: define job types that actually mean something
Before you can build a P&L per job type, you have to decide what a "job type" is. This sounds trivial. It isn't. Split too finely and you'll never get enough volume in any bucket to see a pattern. Split too coarsely and you're back to a blended number that hides everything.
Never miss a job or delay a dispatch again.
Voltzly helps you schedule, assign, and track every electrical job efficiently.
- Unified job scheduling
- Real-time technician tracking
- Automated client notifications
No credit card required
For most residential and light-commercial shops, five to eight categories is the sweet spot. Something like:
-
Service / troubleshooting calls
-
Panel upgrades and service changes
-
EV charger installs
-
Rewires and remodels
-
Small installs (fixtures, fans, dedicated circuits)
-
New construction rough-in / trim
-
Warranty & callbacks (yes, this gets its own bucket)
That last one matters. When callbacks are their own category, you stop pretending they're free and start seeing the true cost of quality problems. More on that later.
Your job types should map to how you estimate and dispatch, not how you bill. If you quote panel upgrades one way and service calls another, they're different animals and deserve different P&Ls.
The job-type P&L template
Here's the structure. Deliberately simple — you want something a project manager can fill in without an accounting degree.
| Line item | What goes here | Common mistake |
|---|---|---|
| Revenue | Invoiced amount for the job | Including tax or financing fees |
| Direct materials | Parts actually used, at real cost | Using estimate quantities, not actuals |
| Direct labor | Tech hours × loaded rate | Using base wage, not loaded cost |
| Travel / windshield | Drive hours × loaded rate + vehicle cost | Leaving this in overhead |
| Callback cost | Return-trip labor + parts | Not tracking it at all |
| Admin load | Scheduling, invoicing, follow-up time | Ignoring it entirely |
| Job gross margin | Revenue minus everything above | — |
The "loaded rate" point is where most shops undercount. A tech who earns $32/hour actually costs you closer to $48–$55 once you add payroll taxes, workers' comp, benefits, and non-billable time. If you cost labor at base wage, every job looks more profitable than it is. This connects directly to line-item costing discipline — the same rigor that keeps you from underquoting panel upgrades applies to measuring actuals after the fact.
Once you have this template filled in for even 30–40 completed jobs across your categories, the picture usually gets uncomfortable fast. That's the point.
A cadence for variance reviews (this is where most shops quit)
Building the template is the easy part. The reason job profitability tracking dies in most shops is that it becomes a one-time exercise. Someone runs the numbers once, gets alarmed, and then never does it again because there's no rhythm.
-
Weekly (15 minutes) Flag any completed job where actual margin missed the estimate by more than a set threshold — say 10 points. Don't analyze yet. Just flag.
-
Biweekly (30–45 minutes) Review the flagged jobs together. Look for patterns, not individual blame. Three service calls that all blew their material budget is a signal, not three accidents.
-
Monthly (1 hour) Roll up margin by job type. Compare this month to the trailing three months. Decide if any category needs a price change, a scope change, or to be cut entirely.
-
Quarterly Revisit the job-type definitions themselves. As the mix shifts, categories that made sense in January might need splitting by summer.
The variance review is where measurement turns into money. A job that missed by 15 points tells you nothing on its own. Five jobs missing the same way tell you exactly where the leak is. That estimate-to-actual feedback loop is the engine — without it, you're just collecting numbers.
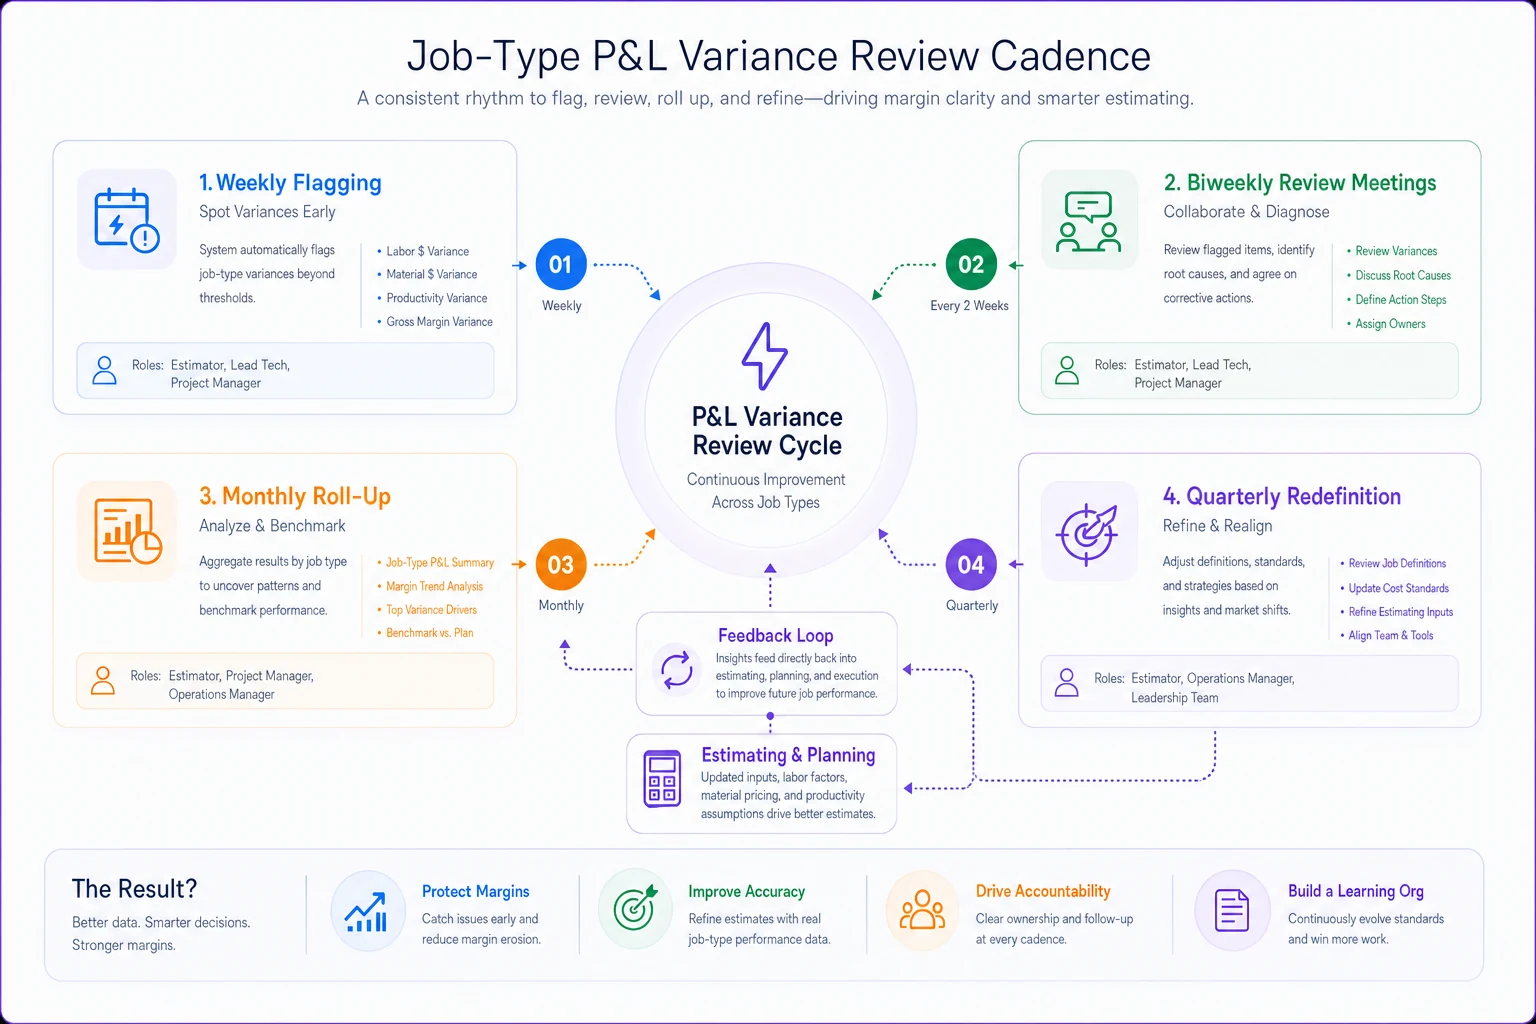
Here's a simple visual of that cadence.
One thing worth noting: the biweekly review works best when the estimator and the lead tech are both in the room. The estimator learns why the field couldn't hit the number, and the field learns what the estimate assumed. That two-way loop closes gaps faster than any report.
The five-fix playbook for the four big leaks
Once you're running variance reviews, the same four leak sources show up again and again. Here's how to attack each one, plus a fifth fix that ties them together.
Fix 1 — Materials: kill the estimate-actual gap
The most common material leak isn't theft or waste. It's estimate drift. The estimate assumes you buy a breaker at contractor pricing, but the tech grabs it retail on the way to the job because the van was out of stock. That $12 part becomes $34, and it happens dozens of times a month.
The fix is upstream: make sure the truck carries what the common job types actually need, so nobody's paying retail to keep a job moving. Van stock is a margin issue disguised as a logistics issue — the same principle behind proper van-stock lists and replenishment triggers. Track material variance by job type and you'll see which categories keep forcing emergency retail runs.
Fix 2 — Travel: stop letting windshield time hide
Drive time is the leak nobody puts on a job. A two-hour round trip for a 45-minute service call is a money-loser, but if the drive sits in overhead, the job looks profitable.
Two moves help. First, actually charge travel to the job in your P&L template. Second, when a job type consistently loses money to travel, that's your signal to add a trip charge, set a minimum ticket, or restructure how you cluster that work geographically. You can't fix what you refuse to measure.
Fix 3 — Callbacks: treat them as their own P&L line
A callback is a job you already got paid for, now costing you a second visit. If it lives in overhead, you'll never feel it. If it's a line on the job's P&L — and a category of its own — it becomes visible and infuriating in the right way.
Track callbacks back to the original job type and the original tech. What shows up across a lot of shops: callbacks cluster. A handful of job types and one or two situations produce most of them. When you can see that a specific job type generates a 6–8% callback rate versus 1% for others, you know exactly where to put your QA effort. A single callback on a service call can wipe out the margin on the next three.
Fix 4 — Admin: the invisible per-job tax
Every job carries admin: scheduling, permit paperwork, invoicing, chasing the customer for payment, filing photos. For a clean panel upgrade that runs $4k, thirty minutes of admin barely registers. For a $180 service call, that same thirty minutes can eat half the margin.
The fix is to weight admin by job type, not spread it evenly. Small jobs carry a disproportionate admin burden per revenue dollar. Once you see that, you can either bundle small jobs, set a minimum, or streamline the paperwork specifically for high-volume low-ticket work.
Fix 5 — Close the loop: feed findings back into estimating
The four fixes above are useless if the lessons don't reach the estimate. Every variance finding should update how you quote.
If service calls keep losing on travel, the trip charge goes up. If a job type keeps generating callbacks, either the scope or the price changes. If materials keep drifting, the estimate's material line gets padded with a realistic contingency. The variance review isn't a report card — it's the input to next month's pricing.
Real scenario: a two-truck shop finds its bleeder
A two-truck residential shop, roughly $900k in annual revenue, ran a blended margin around 36% and couldn't understand why cash was always tight. The owner assumed the problem was overhead.
They built job-type P&Ls for about six weeks of completed work — nothing fancy, a shared spreadsheet filled in as jobs closed. The picture:
-
Panel upgrades and EV installs
healthy margins, low 40s
-
Rewires
solid, mid-30s
-
Service / troubleshooting calls
negative margin once travel and admin were loaded on
Service calls were about a third of their job volume and were quietly losing a few points on nearly every ticket. The blended number looked fine only because panels were carrying the whole operation.
The fixes weren't dramatic. They added a modest trip charge, set a minimum service ticket, and clustered service calls into two set days a week to cut windshield time. Within a couple of months, service calls moved from negative to a small positive margin, and the blended number crept up 3–4 points. On $900k, that's real money — roughly $30k–$36k extra annually — from work they were already doing, just priced and routed better.
Nobody worked more hours. They just stopped guessing.
When this framework makes sense — and when it doesn't
When it's worth it: Once you're past one truck and running mixed work — service plus installs plus the occasional big project. That's when the mix hides the leaks and blended numbers actively mislead you. If you're tracking KPIs at all, this slots right into the same operating rhythm as your KPI dashboard.
When it's overkill: A solo operator doing one kind of work — say, only service calls — doesn't need job-type P&Ls. You already know your one number. The framework earns its keep when you have variety in the work and volume enough to see patterns.
Who should not bother yet: If you can't reliably capture actual labor hours and actual material costs per job, don't start here. Fix your field data capture first. Job-type P&Ls built on guessed inputs are worse than no P&Ls — they give you false confidence in wrong numbers.
Making the tracking survive contact with a busy week
The honest failure mode isn't that shops don't understand this. It's that filling in job-type P&Ls by hand dies the first busy week. Techs don't log hours to the right bucket, material costs get entered late, and by the time someone reconciles it the data's a month stale and nobody trusts it.
This is where the right operational setup matters more than the theory. When your scheduling, time capture, material tracking, and invoicing all feed the same system, the job-type P&L mostly builds itself — labor lands on the right job because the tech clocked into that job, materials attach because they were logged against the work order, and callbacks link back to the original ticket automatically. The variance review becomes something you read, not something you assemble from scratch every two weeks.
Make the logging workflow part of dispatch so techs clock into jobs before they leave the yard.
The point isn't the software. It's that a profitability framework only works if the data collection is close to invisible. If measuring costs you an hour a day, you'll stop measuring, and you'll be right back to a blended number that lies to you.
The takeaway
The shops that consistently protect margin aren't the ones with the fanciest accounting. They're the ones that stopped trusting a single blended number and started asking a sharper question: which type of work actually makes us money, and which type is just riding along?
Answer that with a job-type P&L, keep it honest with a real review cadence, and attack the four predictable leaks — materials, travel, callbacks, admin — one at a time. You'll usually find that the biggest profit gain isn't in landing more work. It's in fixing the work you're already doing.
Ready to optimize your electrical service operations?
Join 500+ electrical service companies using Voltzly to improve scheduling accuracy, enhance client satisfaction, and boost operational efficiency.