

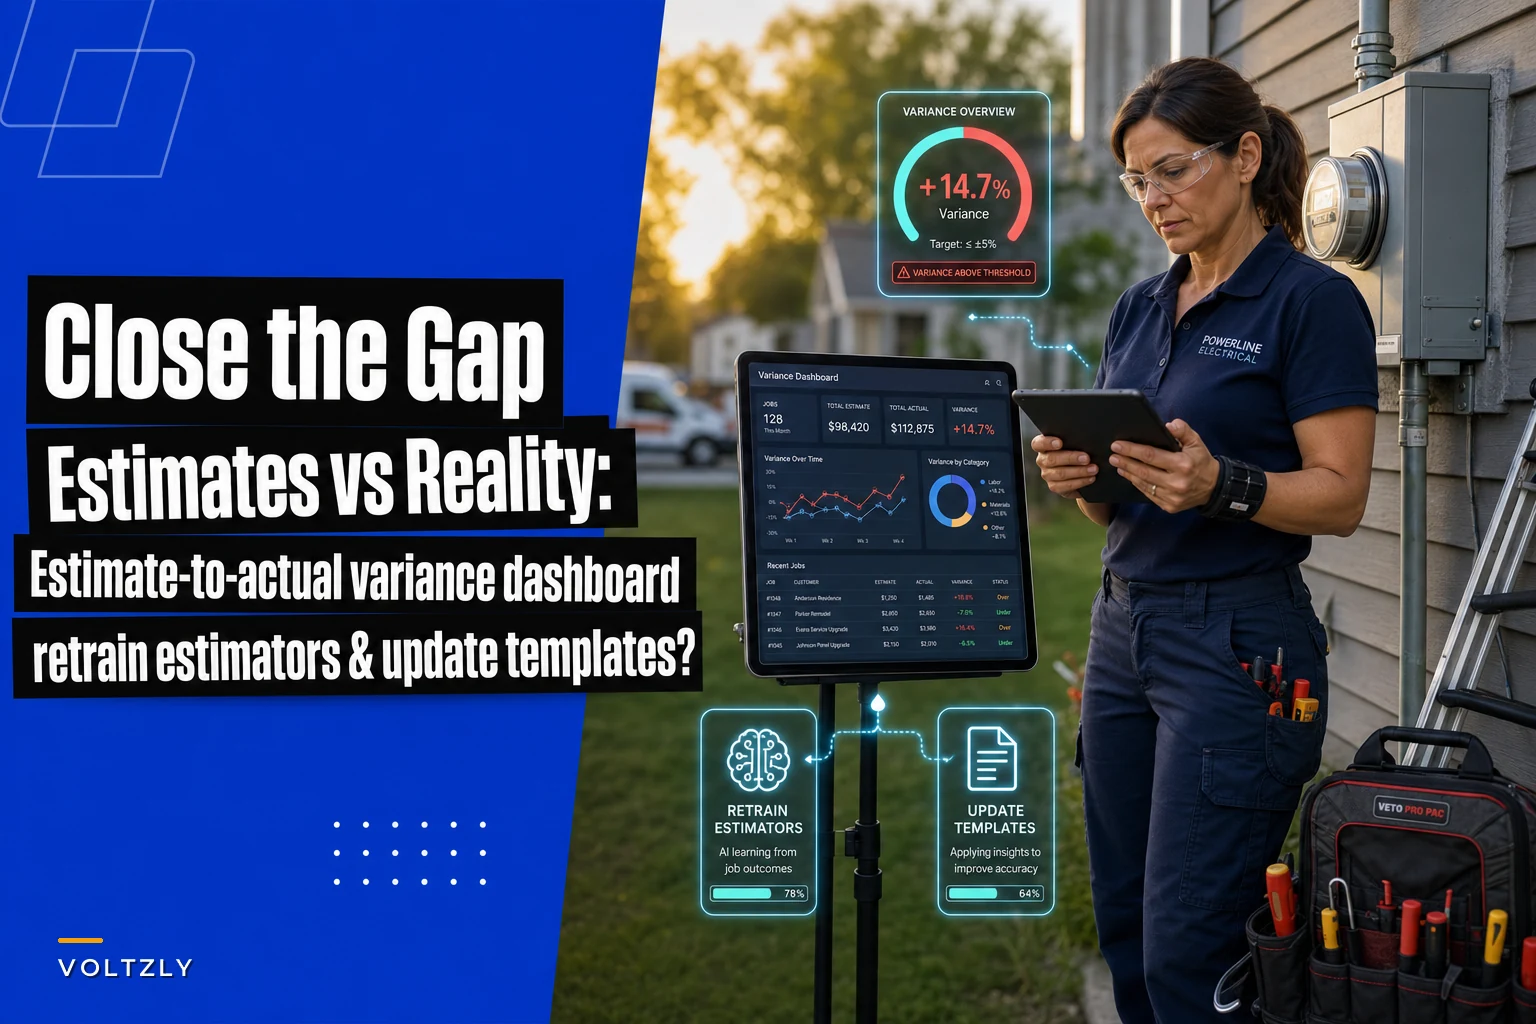

Every electrical contractor knows that stomach-drop feeling when the job wraps and the actual hours are way off from what you quoted. Maybe your journeyman took 14 hours on that service upgrade you estimated at 8. Or that "simple" outlet addition turned into a half-day nightmare because of unexpected blocking in the walls.
The real problem isn't the occasional miss—it's that most shops never systematically track estimate to actual variance for electricians. You're flying blind, repeating the same estimation mistakes job after job, quarter after quarter.
Why estimate variance becomes a profit killer
Variance tracking sounds like corporate nonsense until you realize you're leaving somewhere between $2,400 and $4,800 per tech per month on the table from estimation errors alone. Those numbers come from contractors running 3-8 person crews who finally started measuring their gaps.
The pattern usually looks like this: your lead estimator quotes based on gut feel plus some rough time calculations. Field techs do the work. Invoices go out. Nobody circles back to compare what actually happened against what was estimated. Next month, same mistakes. Same profit leaks.
What makes this particularly painful for electrical work is the wide variation in job complexity. Installing a ceiling fan in a newer home with good attic access takes maybe 90 minutes. Same fan in a 1940s plaster-and-lath house with no attic access? You're looking at 3-4 hours minimum. Without tracking these patterns, your estimates stay permanently optimistic.
The hidden patterns eating your margins
Certain patterns show up across electrical contractors tracking variance data that most shops completely miss.
Never miss a job or delay a dispatch again.
Voltzly helps you schedule, assign, and track every electrical job efficiently.
- Unified job scheduling
- Real-time technician tracking
- Automated client notifications
No credit card required
Specific task categories drift over time. Panel upgrades gradually take longer as code requirements change or your crew develops different habits. What took 6 hours last year now consistently runs 7.5, but your estimates haven't moved.
Individual estimators have consistent biases. One estimator might chronically underestimate troubleshooting time by 30-40%. Another might nail residential work but miss commercial jobs by 25% regularly. Without data, these patterns stay invisible.
Certain job conditions create predictable variance. Older homes (pre-1970) almost always run 20-35% over estimate. Occupied commercial spaces during business hours typically add 15-25% to labor time. These aren't random—they're systematic, and you can adjust for them once you actually see the pattern.
The variance compounds in ways that crush profitability. An hour here, ninety minutes there—across 40-60 jobs per month, you're potentially giving away 80-120 hours of unbilled labor. At shop rates around $125-150/hour, that's serious money disappearing with nothing to show for it.
Building a variance tracking system that actually works
Most contractors who try variance tracking give up within a month because they overcomplicate it. They build elaborate spreadsheets with 47 columns that nobody fills out, or they try to track every single line item when they should focus on the big movers.
Start with just five job categories that represent 70-80% of your work. For most residential shops, this looks like:
-
Service calls (troubleshooting/repairs)
-
Panel upgrades/heavy-ups
-
New circuits/outlets
-
Lighting installations
-
EV charger installs
Track only three numbers per job:
-
Estimated hours
-
Actual hours worked
-
One complexity flag (old construction, occupied space, difficult access, etc.)
The key is making data entry stupid simple. Your field lead takes 30 seconds after each job to log actual hours—even a basic spreadsheet works initially. No essays, no detailed breakdowns. Just: "Panel upgrade, estimated 6 hours, actual 8.5 hours, old construction."
Make the data entry step the absolute shortest task for techs—30 seconds max.
No essays, no detailed breakdowns. Just: "Panel upgrade, estimated 6 hours, actual 8.5 hours, old construction."
Creating variance thresholds that trigger action
Random variance is normal. Sometimes jobs go faster, sometimes slower. What matters is systematic variance that points to a real problem.
| Monthly Job Volume | Individual Job Variance Alert | Category Trend Alert | Estimator Bias Alert |
|---|---|---|---|
| Under 30 jobs | >40% over or under | 3 jobs in category >25% over | 5 total jobs >30% over |
| 30-60 jobs | >35% over or under | 5 jobs in category >20% over | 8 total jobs >25% over |
| 60+ jobs | >30% over or under | 7 jobs in category >20% over | 10 total jobs >20% over |
When variance crosses these thresholds, something specific needs to happen—not just a vague "we'll estimate better next time."
Individual job variance triggers an immediate review. Was it a scope change? Hidden conditions? Estimation error? Document the cause so you can spot patterns later.
Category trend variance means your baseline estimate for that work type needs updating. If panel upgrades consistently run 20% over for three months straight, your new baseline should be 7.5 hours, not 6.
Estimator bias variance triggers retraining or estimate review requirements. Maybe that estimator needs to shadow field work again, or their estimates need a second set of eyes until the pattern corrects.
The retraining triggers most shops miss
Variance data reveals training gaps you'd never spot otherwise. A journeyman who consistently runs 30% over on troubleshooting calls might be using outdated diagnostic methods. An apprentice taking twice the estimated time on outlet installations might not know the shortcuts your experienced guys have internalized over years.
The variance dashboard should flag when specific technicians consistently exceed estimates in certain categories. This isn't about punishment—it's about targeted improvement.
One shop found their newer tech was taking 45-60 minutes for standard outlet additions that should take 25-30 minutes. Turns out nobody had walked him through their approach to residential rough-ins or shown him the faster box-mounting techniques the senior guys used. A half-day of targeted training brought his times in line and saved roughly $3,000/month in labor overruns.
Template adjustments based on variance patterns
Your estimate templates shouldn't be static documents. They need to evolve based on what variance data tells you about reality. This is where most contractors fail—they create templates once and never update them systematically.
When category variance consistently runs high, you have three adjustment options:
Increase base time estimates by the average variance percentage. If lighting installs average 18% over estimate across 20+ jobs, bump your template times by 15-20%.
Add conditional modifiers for common complications. If homes built before 1960 consistently add 35% to labor time, build that into your template as a checkbox that automatically adjusts the estimate.
Create separate templates for distinctly different scenarios. Instead of one "outlet installation" template, you might need "outlet installation - new construction," "outlet installation - renovation," and "outlet installation - old/difficult construction." The variance data tells you where these splits actually make sense.
A concrete example: after tracking variance for four months, one electrical contractor noticed commercial tenant improvement jobs consistently ran 25-40% over when work happened during business hours versus after hours. They created two template versions with different time allocations. Estimate accuracy improved immediately, and they stopped eating labor costs on occupied-space work.
Contingency rules that protect margins without killing close rates
Most contractors either use no contingency and eat overages, or use arbitrary percentages pulled from thin air. Your variance tracking should drive specific contingency rules, not gut feelings.
-
Jobs with zero complexity flags
5-8% contingency
-
One complexity flag (old construction OR difficult access OR occupied space)
12-15% contingency
-
Two complexity flags
20-25% contingency
-
Three or more flags
30% contingency or decline the job
These aren't random percentages—they come from actual variance data showing how much these factors typically impact job duration. You can explain to customers exactly why certain jobs carry higher contingencies and back it up with historical data rather than vague concerns about "unforeseen issues."
The variance dashboard should calculate recommended contingency automatically based on job characteristics and historical patterns, which removes the guesswork and emotion from pricing decisions.
Building the feedback loop without drowning in data
A functional variance feedback loop needs just three components:
-
Simple data capture that takes under a minute per job. Your field team logs actual hours and one or two condition flags. Nothing more complex than that, at least initially.
-
Automated variance calculation that runs weekly or biweekly. Even a basic spreadsheet with formulas can calculate variance percentages and flag threshold violations automatically.
-
Scheduled review sessions monthly. Spend 45 minutes reviewing flagged variances, updating templates, and identifying retraining needs. This isn't a daily task—it's a periodic calibration.
One contractor simplified this to a 15-minute Friday routine: techs text actual hours to the office manager, who enters them into a spreadsheet that automatically calculates variance and highlights problems.
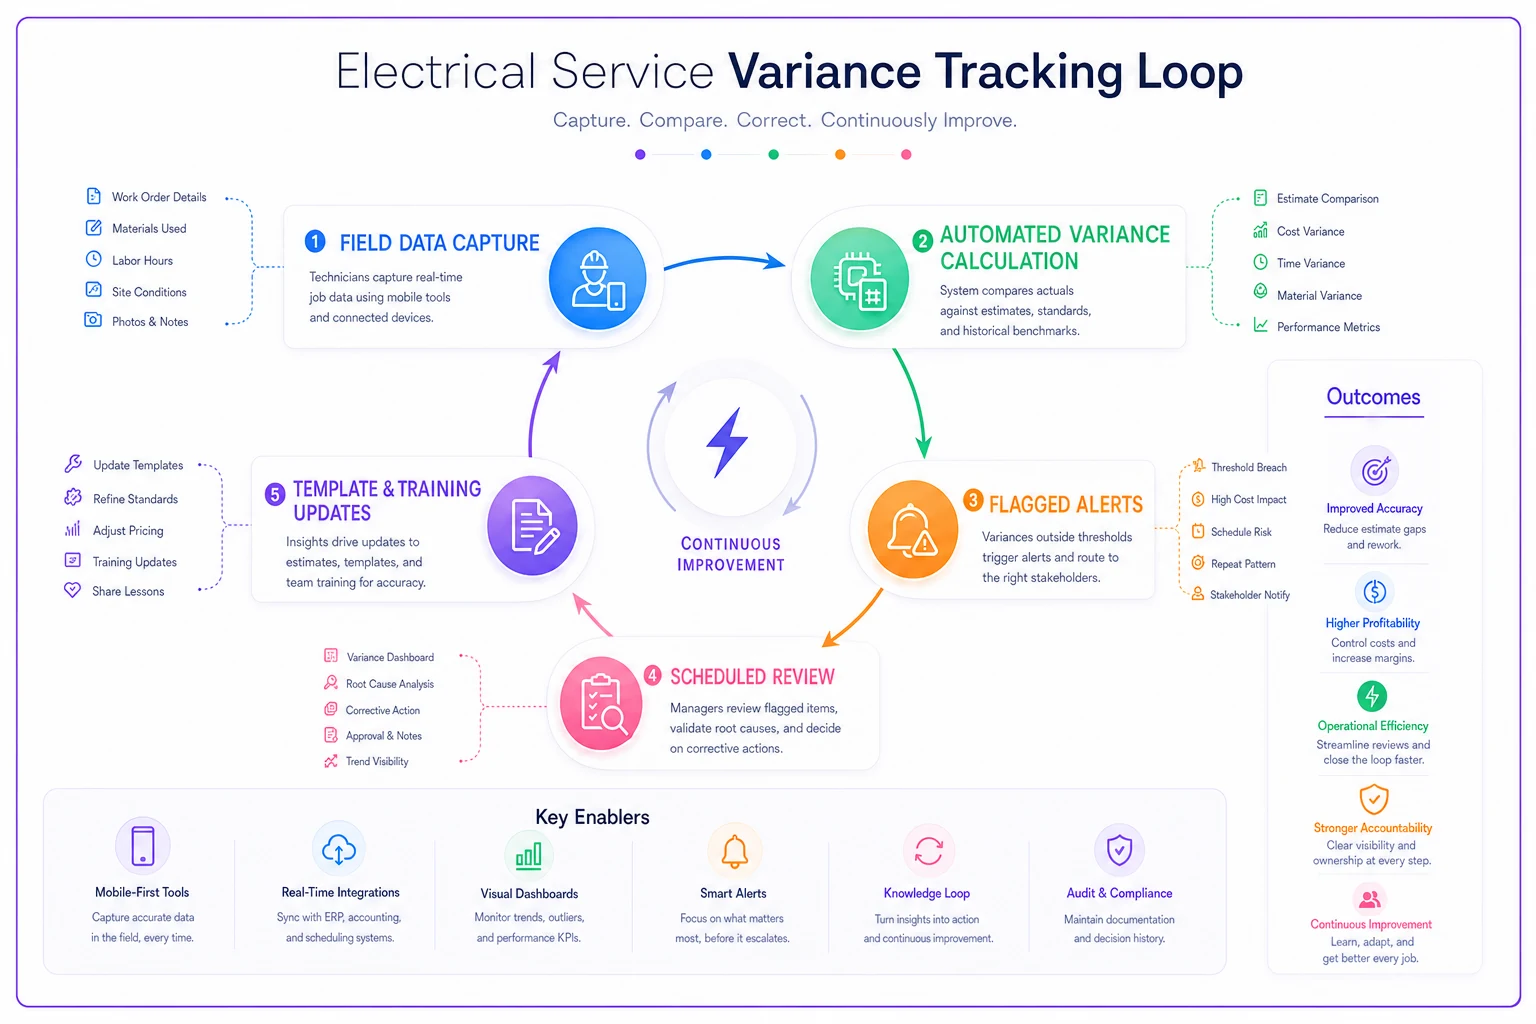
Monthly review takes about an hour. That minimal investment caught systematic estimate problems costing $8,000-12,000 monthly.
Early warning systems for estimate drift
Variance doesn't usually explode overnight—it drifts gradually until suddenly you're hemorrhaging money. Your tracking system needs to catch drift before it becomes a crisis.
Watch for these patterns:
Creeping category variance where average overages increase 2-3% monthly. EV charger installs that ran 5% over in January, 8% over in February, 12% over in March indicate something systematic is changing.
Seasonal variance patterns that repeat yearly. Attic work in July-August might consistently run 20-30% over due to heat. Outdoor work in December-January might add 15-25% from weather delays. These should trigger automatic seasonal adjustments to estimates.
New code or requirement impacts that affect entire categories. When local jurisdictions add inspection requirements or code changes, variance spikes in affected categories. Your system should flag when multiple jobs in a category suddenly shift variance patterns at the same time.
The early warning system prevents that scenario where you suddenly realize you've been underestimating panel upgrades by 30% for six months straight. Catching drift at 10% lets you adjust before significant damage occurs.
When variance indicates pricing model problems
Sometimes variance data reveals that your entire pricing model needs restructuring, not just minor tweaking. High variance in certain categories might mean those jobs shouldn't be flat-rated at all. Troubleshooting calls with 60-80% variance between jobs probably need T&M pricing. Installation work with 10-15% variance can stay flat-rate.
Your variance data becomes the objective basis for these decisions. Instead of guessing which work to price differently, you have clear data showing where flat-rate pricing creates real risk versus where it produces predictable margins.
The KPI dashboard patterns we've covered before should include variance metrics that trigger pricing model reviews when certain thresholds get crossed consistently.
Making variance tracking sustainable with the right tools
Manual variance tracking works for about two weeks before people stop doing it. The friction of data entry, calculation, and analysis kills most tracking initiatives before they gain any traction.
Modern operational platforms can capture time data automatically through mobile apps, calculate variance in real-time, and flag issues immediately rather than waiting for month-end analysis. That removes the friction that kills most variance tracking efforts early on.
AI-assisted analysis can also surface patterns humans miss—like variance correlations between specific estimators and job types, or subtle drift that predicts future problems. Instead of manually checking spreadsheets for threshold violations, the system alerts you when action is needed. The most effective approach integrates variance tracking into existing workflows rather than bolting on something new. When techs already log hours for payroll, that same data feeds variance calculations. When estimates get created, historical variance automatically adjusts baseline times. The feedback loop becomes part of normal operations rather than an add-on task that quietly dies after a few weeks.
The compound effect of variance reduction
Tightening estimate to actual variance creates compound benefits beyond just margin protection. Accurate estimates mean better scheduling—you're not constantly shuffling jobs when they run long. Customer satisfaction improves when you consistently hit your time windows. Cash flow becomes more predictable when job costs actually match estimates.
Over 6-12 months of variance tracking and adjustment, most contractors see their average variance drop from 25-35% down to under 15%. On $40,000-60,000 in monthly labor costs, that improvement translates to $4,000-9,000 in recaptured margin monthly. The effort required is maybe 3-4 hours monthly once the system is running.
Variance tracking also builds institutional knowledge that survives employee turnover. When your lead estimator leaves, their replacement inherits templates already adjusted for reality, not optimistic guesses. New field techs learn quickly where their times don't match standards. The whole operation becomes more predictable.
Start tracking today, even imperfectly
The perfect variance tracking system that never gets implemented is worthless compared to the basic system you start using today. Pick your five most common job types. Create a simple spreadsheet with estimated hours, actual hours, and variance percentage. Have your lead tech spend two minutes per job logging actual times.
Review the data weekly at first, looking for obvious patterns. Don't wait for statistical significance—if three panel upgrades in a row run 30% over, something needs attention now. Adjust your estimates based on what you learn. Track whether the adjustments actually improve accuracy.
Within a month, you'll spot patterns that have been costing you thousands. Within three months, your estimates will tighten noticeably. Within six months, variance tracking becomes as natural as tracking accounts receivable—just another operational fundamental that protects profitability.
The gap between estimated and actual performance doesn't close itself. But with systematic tracking, clear thresholds, and consistent adjustment, you can shrink that gap from a profit-killing chasm to a manageable variance that your margins can absorb.
The question isn't whether you can afford to track variance—it's whether you can afford not to.
Ready to optimize your electrical service operations?
Join 500+ electrical service companies using Voltzly to improve scheduling accuracy, enhance client satisfaction, and boost operational efficiency.