



Fleet total cost of ownership for electrical contractors gets complicated fast when you're running between 2 and 50 vehicles. Each van represents around $85,000 in annual revenue potential, but most electrical shops track vehicle costs like they're just another expense line. The real challenge isn't tracking what you spend on gas and oil changes—it's understanding when a $4,200 transmission repair on a 2019 Transit actually costs you $12,000 in lost productivity and rental fees.
I recently went through fleet data from 47 electrical contractors running between 3 and 28 vehicles. The pattern was consistent: shops under 10 vehicles had almost no preventive maintenance system beyond oil change stickers, while shops over 20 either outsourced everything to a fleet management company (expensive) or had one person drowning in spreadsheets. Neither approach actually controlled costs.
The shops with the lowest fleet TCO weren't running fancy software or employing dedicated mechanics. They were running lightweight preventive maintenance programs built around three things: mileage-based triggers that actually got followed, simple replacement scoring that kept emotion out of decisions, and a monthly dashboard that took 15 minutes to update.
Why electrical contractor fleets break differently than delivery fleets
Your fleet doesn't operate anything like a delivery fleet or HVAC fleet, and that difference matters when you're trying to track costs accurately. An electrician's van sits at job sites for 4-6 hours with the engine off but auxiliary power running. The inverter system pulling 2000W while your tech troubleshoots a panel puts completely different stress on the electrical system than stop-and-go delivery driving. Your alternators tend to fail around 65,000 miles instead of the usual 90,000.
Then there's the weight problem. A fully stocked electrical van is carrying 1,800-2,400 pounds of inventory, tools, and materials—consistently maxed out, not variable like delivery vehicles. That constant load means brake pads wear at 22,000-25,000 miles instead of 35,000. Shocks and struts start affecting ride quality around 50,000 miles. The rear leaf springs on Transit 250s start sagging around 70,000, especially if crews regularly haul transformers or large spools of MC cable.
The cost most shops miss: your vans generate roughly $350-400 per day in billable hours when they're running. A van down for unexpected repairs doesn't just cost you the repair bill—it costs you the tech's productivity, the scramble to reassign jobs, and often a rental van at $95/day that nobody wants to drive because nothing's organized right.
The mileage trigger system that actually works
Mileage-based maintenance only works if someone actually tracks mileage and triggers the work. Most shops fail here because they overcomplicate it. The system that works uses three simple components: a Monday morning mileage check (5 minutes for 10 vehicles), service triggers set 500 miles before actual service points, and a two-week scheduling window for non-emergency maintenance.
Never miss a job or delay a dispatch again.
Voltzly helps you schedule, assign, and track every electrical job efficiently.
- Unified job scheduling
- Real-time technician tracking
- Automated client notifications
No credit card required
Here's the trigger schedule that fits electrical contractor usage patterns:
Basic Service Triggers:
-
Oil change
5,500 miles (trigger at 5,000)
-
Tire rotation
7,500 miles (trigger at 7,000)
-
Air filter
15,000 miles (trigger at 14,500)
-
Cabin filter
15,000 miles (trigger at 14,500)
-
Brake inspection
20,000 miles (trigger at 19,500)
Electrical Fleet-Specific Triggers:
-
Alternator test
50,000 miles (trigger at 49,500)
-
Battery and inverter system check
25,000 miles (trigger at 24,500)
-
Suspension inspection
40,000 miles (trigger at 39,500)
-
Transmission service
45,000 miles (trigger at 44,500)
The 500-mile buffer gives you flexibility to schedule maintenance during slow periods or when you have backup vehicles available. Missing an oil change by 2,000 miles because "we were slammed" is exactly how the degradation cycle starts that leads to bigger failures down the road.
The Monday morning check becomes someone's 5-minute task—usually whoever handles dispatch scheduling. They write down odometer readings from photos techs send (most shops already require morning vehicle inspection photos for insurance anyway). Any vehicle within 500 miles of a trigger gets flagged for scheduling.
Rotate the Monday mileage check between office staff so it doesn't become one person's burden.
This small, consistent practice is what makes mileage triggers actually work in shops that can't afford full-time fleet staff.
Replacement scoring prevents expensive emotional decisions
The worst fleet decisions happen when a van breaks down Thursday afternoon and you need it running by Monday. That's when you approve a $4,200 repair on a van that should've been replaced three months ago. A replacement scoring system removes emotion from these calls by establishing clear thresholds before problems hit.
The scoring works on a 100-point scale across five factors:
| Factor | Weight | Measurement |
|---|---|---|
| Age/Mileage | 30 points | Under 100k = 30, 100-150k = 20, 150-200k = 10, Over 200k = 0 |
| Repair History | 25 points | Under $2k/year = 25, $2-4k = 15, $4-6k = 5, Over $6k = 0 |
| Downtime | 20 points | 0-2 days/year = 20, 3-5 days = 10, 6-10 days = 5, Over 10 = 0 |
| Tech Feedback | 15 points | No complaints = 15, Minor issues = 10, Regular problems = 5, Hates it = 0 |
| Upcoming Repairs | 10 points | None expected = 10, Under $1k = 5, Over $1k = 0 |
Vehicles scoring above 70 keep running with normal maintenance. Scores between 50-70 mean you start shopping for replacements but keep maintaining. Below 50 means any repair over $1,500 triggers replacement instead of repair.
This catches the death spiral before it starts. That 2018 Transit with 165,000 miles might still run okay, but when it scores 48 points and needs a $2,800 AC compressor, you know what the answer is. The scoring also helps with planning—when three vans drop into the 50-70 range at once, you know to budget for replacements within 6-8 months.
Building the monthly fleet dashboard
The monthly dashboard captures total cost patterns, not individual transactions. Most shops drown in fuel receipts and repair invoices without ever seeing the bigger picture. A useful dashboard fits on one page and takes about 15 minutes to update using data from your accounting system and maintenance log.
A useful dashboard fits on one page and takes about 15 minutes to update using data from your accounting system and maintenance log.
Core Metrics Section:
-
Total fleet cost this month (all expenses including insurance, registration)
-
Cost per vehicle (total divided by fleet size)
-
Cost per mile driven (total cost divided by fleet miles)
-
Revenue per vehicle (billable hours generated per van)
-
Downtime days (total days vehicles were unavailable)
Vehicle Status Grid:
-
Current mileage
-
Replacement score (updated quarterly)
-
Next service due
-
Days down this month
-
Monthly cost
Trend Indicators:
-
3-month rolling average cost per mile
-
Year-over-year cost comparison
-
Vehicles approaching replacement threshold
-
Upcoming major services (next 60 days)
Visualize the dashboard workflow like this.
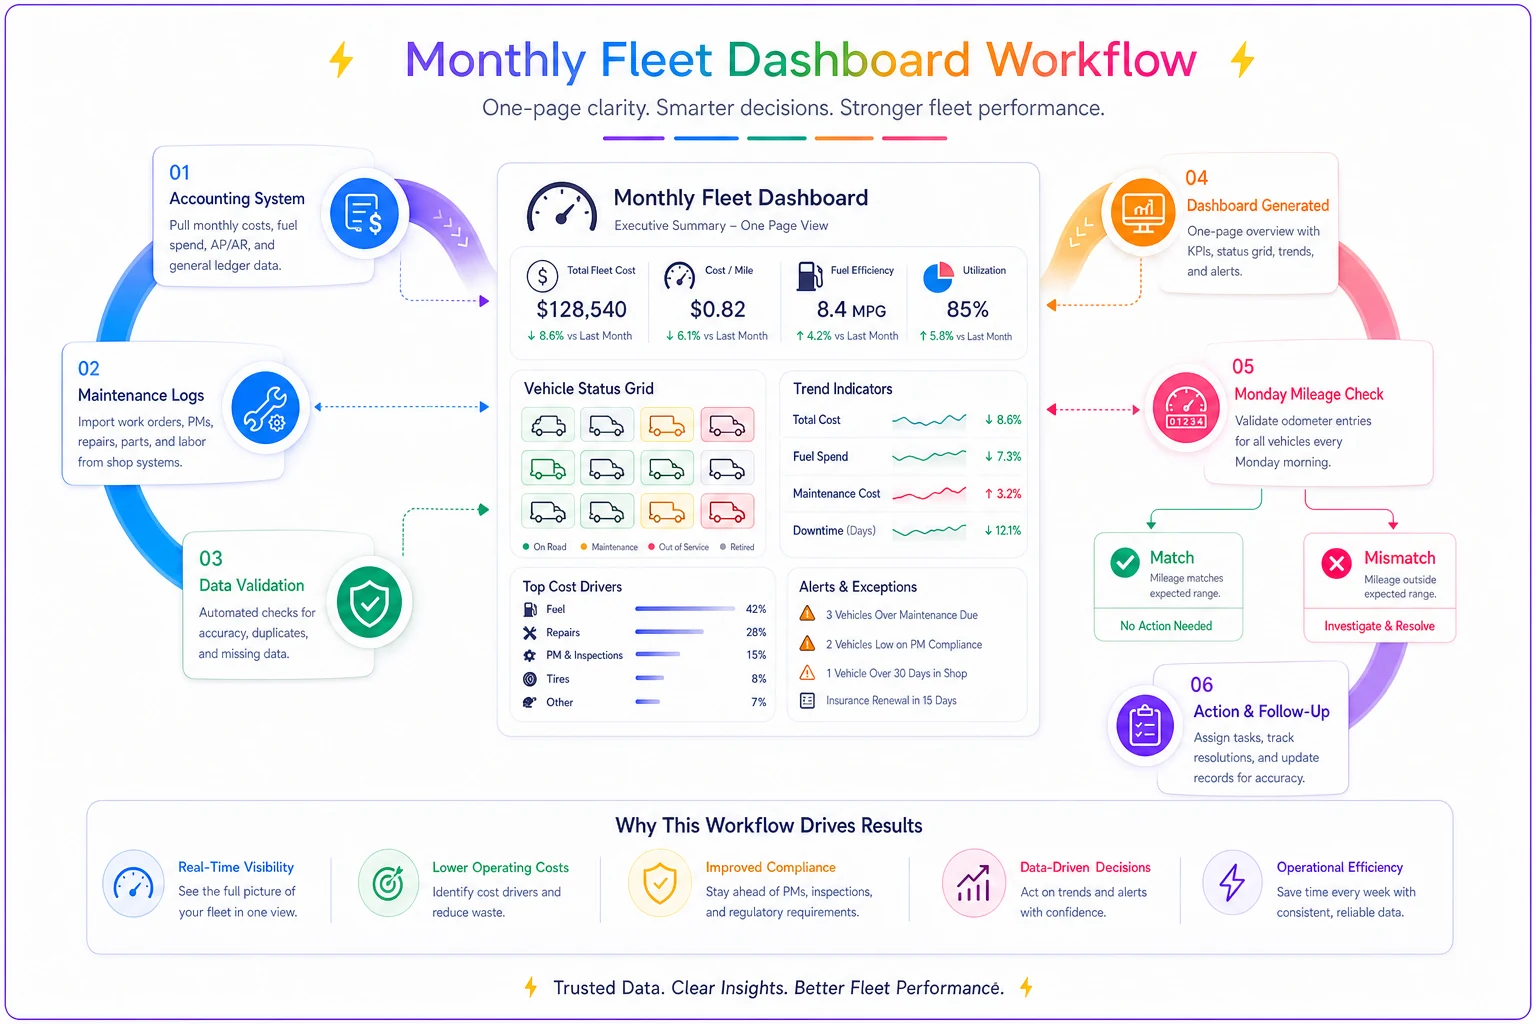
The dashboard reveals patterns individual invoices hide. When cost per mile creeps from $0.42 to $0.51 over three months, something's degrading across the fleet. When Van #4's monthly cost hits $1,800 while others average $1,100, you spot the problem vehicle before it becomes a crisis.
The hidden costs that kill fleet TCO
Fuel and maintenance are obvious. Insurance and registration are predictable. The costs that quietly destroy fleet total cost of ownership hide in operational disruptions.
When a van fails Monday morning, your dispatcher scrambles to reorganize routes. Two techs share a vehicle, cutting productivity by 30-40% because they can't work independently. Jobs get pushed to Tuesday, compressing the schedule. Your tech spends 20 minutes at Home Depot buying parts that should've been in the broken van. The rental van has no shelving, so they waste 10 minutes per job hunting for materials.
Then there are the inventory costs. Each van carries $8,000-12,000 in parts and materials. When a van goes down unexpectedly, that inventory sits idle. If it's in the shop for a week, you either double-stock another van or run jobs with multiple supply runs—neither option is good.
The administrative burden adds up too. Insurance claims for breakdown-related incidents. Rental paperwork. Transferring equipment between vehicles. Dealing with techs complaining about van problems. Each unexpected breakdown generates 3-4 hours of admin work that never shows up in repair costs.
Real shop comparison: reactive vs preventive
Two electrical contractors in the same market, similar size, completely different fleet outcomes:
Shop A (Reactive Approach):
-
12 vehicles, mostly 2017-2020 models
-
No formal maintenance schedule
-
"Fix it when it breaks" mentality
-
Average monthly fleet cost
$18,500
-
Average downtime
6.2 days per vehicle annually
-
Cost per mile
$0.67
-
Two vehicles replaced emergency-style last year (overpaid by roughly $4k each)
Shop B (Preventive System):
-
14 vehicles, mostly 2018-2021 models
-
Mileage trigger system with Monday checks
-
Replacement scoring reviewed quarterly
-
Average monthly fleet cost
$16,200
-
Average downtime
2.1 days per vehicle annually
-
Cost per mile
$0.43
-
Planned replacement of two vehicles, bought off-season (saved about $3k each)
Shop B spends $300-400 monthly on preventive maintenance that Shop A skips. But Shop A spends $2,300 more monthly overall when you factor in emergency repairs, rentals, downtime, and poor replacement timing. That gap comes to roughly $27,000 annually—enough to accelerate replacement cycles and run newer, more reliable vehicles.
Templates to implement immediately
Weekly Mileage Tracker:
Simple spreadsheet with vehicle numbers down the left, dates across the top. One person fills it every Monday morning. Conditional formatting highlights any vehicle within 500 miles of a service trigger. Takes 5 minutes for 20 vehicles.
Replacement Scorecard:
One row per vehicle with the five scoring factors as columns. Update quarterly or when major repairs occur. Sort by total score to see replacement priority. Keep a 6-month history to spot degradation trends.
Monthly Dashboard Template:
Single page with three sections: core metrics (5 numbers), vehicle status (simple table), and trend charts (3 basic graphs). Pull data from your accounting system on the 5th of each month. Share with leadership.
Maintenance Decision Matrix:
-
IF vehicle scores above 70 AND repair under $1,000 THEN approve immediately
-
IF vehicle scores 50-70 AND repair under $2,000 THEN approve but flag for replacement planning
-
IF vehicle scores below 50 AND repair over $1,500 THEN evaluate replacement instead
-
IF emergency repair over $3,000 THEN require same-day leadership decision
Keep a 6-month history to spot degradation trends.
Making the system stick
The system fails when it becomes one person's overwhelming responsibility. The Monday mileage check should rotate between office staff. The monthly dashboard update should be part of regular financial review, not an extra task. Replacement scoring updates quarterly during slow periods—not when you're already scrambling with a breakdown.
Preventive maintenance scheduling needs to fit your operational rhythm. Most electrical contractors have lighter Fridays—that's a natural window for scheduled maintenance. Book oil changes 2-3 weeks out during slow seasons. Keep one backup vehicle per 5-6 active vans to maintain productivity during service.
The real implementation challenge isn't the system itself—it's the mindset shift from reactive to preventive. Techs need to understand that the Monday morning odometer photo protects their own productivity. Your dispatcher needs to see that preventive scheduling prevents emergency scrambles. Leadership needs to accept that spending $400 on preventive maintenance saves $1,200 in emergency repairs and lost time.
Scaling considerations for growing fleets
The system described works well from 2 to about 15 vehicles. Between 15-30 vehicles, you'll need to batch vehicles into service groups to stay efficient. Over 30 vehicles, manual tracking becomes unwieldy and fleet management software or outsourcing starts to make more sense financially.
As you scale, the patterns shift. With 5 vehicles, one breakdown is disruptive but manageable. With 25 vehicles, you'll almost always have one vehicle in the shop, which means dedicated backup vehicles and a rotation system become necessary. The replacement cycle accelerates too—instead of replacing 1-2 vehicles annually, you're replacing 4-5, which requires actual relationships with dealers and auction houses.
The transition to operational software tends to happen around 20 vehicles. Below that, spreadsheets and simple triggers work fine. Above it, AI-powered platforms that automatically flag maintenance needs, track cost trends, and help predict replacement timing start earning their keep. The software doesn't replace the system—it handles the tracking load that gets genuinely difficult to manage manually at scale.
Conclusion
Fleet total cost of ownership for electrical contractors isn't about sophisticated calculations—it's about consistent execution of simple systems. Mileage triggers prevent major failures. Replacement scoring removes emotional decision-making. The monthly dashboard reveals cost patterns before they become problems.
The shops struggling with fleet costs aren't missing some secret strategy. They're missing the discipline to check mileages every Monday, schedule maintenance two weeks out, and score vehicles objectively before a crisis forces the decision.
Start with the Monday morning mileage check. Add replacement scoring next quarter. Build the dashboard once you have two months of decent data. Don't try to perfect everything at once—a basic preventive system running consistently beats a perfect one that gets ignored when things get busy.
Your fleet represents over $2 million in annual revenue generation capability. Every day a van sits broken is $350-400 in lost opportunity. Every emergency repair is a scheduler's nightmare. Every reactive replacement is $3,000-4,000 overpaid. The lightweight system described here takes maybe 2 hours monthly to maintain across your entire fleet—compare that to the 10-15 hours you lose every time a vehicle breaks down unexpectedly. The math isn't complicated. The challenge is starting before the next crisis, not after it.
Ready to optimize your electrical service operations?
Join 500+ electrical service companies using Voltzly to improve scheduling accuracy, enhance client satisfaction, and boost operational efficiency.